


Blog Body
An organisation may have many beneficiary journeys competing for attention: applying for a service, renewing an entitlement, checking progress, making an appeal or finding information. Choosing where to start can seem straightforward when one journey attracts the most visits or complaints. Yet volume alone does not reveal the greatest obstacle, and people who abandon a task may never contact the support team. A useful starting point turns “what should we improve?” into a decision that can be explained: which outcome matters, what evidence shows that it is difficult to achieve, and what intervention can we meaningfully test?
Define the journey through its outcome
“Improve the portal” does not tell a team where responsibility begins or ends. A clearer scope might be: “Help beneficiaries complete a renewal and receive an understandable outcome without an unnecessary visit.” Record the starting point, user groups, channels and end point at which the beneficiary receives value.
Departmental boundaries should not define the whole journey. An application can be submitted successfully online but stall in a back-office process or return without an explanation. The UK Government Service Manual recommends addressing a whole user problem across organisational boundaries while making incremental improvements [2]. We use this as a design principle here, not as a Saudi regulatory requirement.
Write one sentence describing the intended outcome and another identifying what the current improvement cycle excludes. This keeps the intervention manageable while making important dependencies visible.
Gather comparable evidence
Start with a short list of candidate journeys. For each, collect enough evidence to support a fair comparison: applications started and completed, return reasons, waiting time between steps, repeated enquiries and observations of people attempting the task. Investigate operational causes before attributing every difficulty to an interface. A delayed decision or inconsistent interpretation of eligibility may require a different response.
Record the period covered and define each measure. Sessions are not necessarily people, and submitting a form is not always completing the service. Ask whether the evidence includes those who leave before starting, mobile users and people who need assistance. Where evidence is missing, mark it as unknown and commission focused discovery. A poorly measured journey should not automatically receive a low priority.
Separate mandatory action from optional improvement
Before applying weights, identify problems that should not compete as discretionary opportunities. An obstacle that prevents a group from accessing an essential service, a data risk or an issue requiring mandatory remediation should go to the appropriate owner for assessment and action. A small affected population or high repair cost must not bury such a problem inside an average score.
Then compare the opportunities that can reasonably compete for improvement resources. Show evidence confidence alongside the score, and record dependencies requiring another team’s decision. A numerical ranking does not replace a service owner’s responsibility to explain the choice.
Control how journey evidence is shared
In Saudi organisations, a journey map may combine evidence from several channels. Define the analytical purpose and access rights, and review the Personal Data Protection Law where processing can identify a beneficiary [4]. A prioritisation committee rarely needs every individual detail to discuss friction.
Use a case identifier within the analysis and present aggregated volumes and reasons where sufficient. If interviews or observed tasks are needed, define the research questions and relevant groups before collecting data. Weak measurement calls for focused discovery; it should not exclude a journey serving a small group.
Use a compact prioritisation matrix
The following matrix is an illustrative model proposed for this article, not an official standard. Agree scoring definitions before assessing journeys. Give each factor a score from 1 to 5; a higher score indicates greater priority or better readiness, depending on the factor.
| Factor | Weight | Question to answer |
| Importance of the beneficiary outcome | 30% | What happens if the person cannot complete the task? |
| Severity of friction | 25% | Does the problem cause significant waiting or rework? |
| Reach of the problem | 15% | How many cases or groups are affected in the same period? |
| Ability to measure improvement | 15% | Can we establish a baseline and observe the outcome? |
| Feasibility of a bounded intervention | 15% | Are ownership, resources and dependencies manageable? |
Calculate the total by multiplying each score by its weight and adding the results. Attach a short reason and evidence to every score. Experience, operations and data representatives can score independently, then discuss differences. Disagreement may expose a knowledge gap rather than a simple difference of opinion.
An illustrative decision
Consider a hypothetical service organisation comparing three journeys. These figures are examples, not RMG or client results. Using the factor order above, renewal receives scores of 4, 4, 4, 5 and 4; status tracking receives 3, 3, 5, 4 and 5; and appeals receive 5, 5, 2, 2 and 1.
| Journey | Score out of 5 | Illustrative decision |
| Complete a renewal | 4.15 | Start a bounded intervention with an owner and available data |
| Understand application status | 3.75 | Prepare as the next priority or a small parallel improvement |
| Submit and track an appeal | 3.50 | Investigate dependencies and measurement gaps |
The last score does not mean appeals matter less. Their importance and friction are high, but measurement and implementation readiness are weaker in this example. If investigation identifies denial of a right or a mandatory issue, use the earlier escalation gate. Also test sensitivity: if a small weight change reverses the ranking, present the candidates as close and seek more evidence before committing resources.

Conceptual illustration of investigating friction before choosing an intervention.
Turn the priority into an improvement hypothesis
Selecting renewals does not justify redesigning every screen. Identify the point of friction: understanding requirements, attaching a document or interpreting a returned application. Form one hypothesis, such as: “Showing a clear, application-specific requirements list before the person starts may reduce returns caused by missing documents.”
Treat this as something to test, not a promised outcome. Assign a service owner, an operational partner and a measurement owner. Document the change, duration, included groups and a way to restore the previous route if harm appears. A prototype with realistic tasks may be appropriate before changing the live service. The decision should produce a coherent intervention, not a project larger than the evidence supports.
Connect the change to an outcome and safeguards
GOV.UK’s guidance on service metrics starts with purpose, benefits and hypotheses, then considers data and comparison with a baseline, combining qualitative research with quantitative measurement [3]. For the renewal example, a primary measure could be the proportion of in-scope applications completed at first submission, with the numerator, denominator and exclusions explicitly defined.
Add safeguards: task duration, requests for assistance and errors reaching operations. A return rate may improve because more people abandon the task before submission. Compare similar periods and record changes in demand, policy or channels. Do not attribute every difference to the intervention when other changes occurred, or generalise from a small sample without qualification.
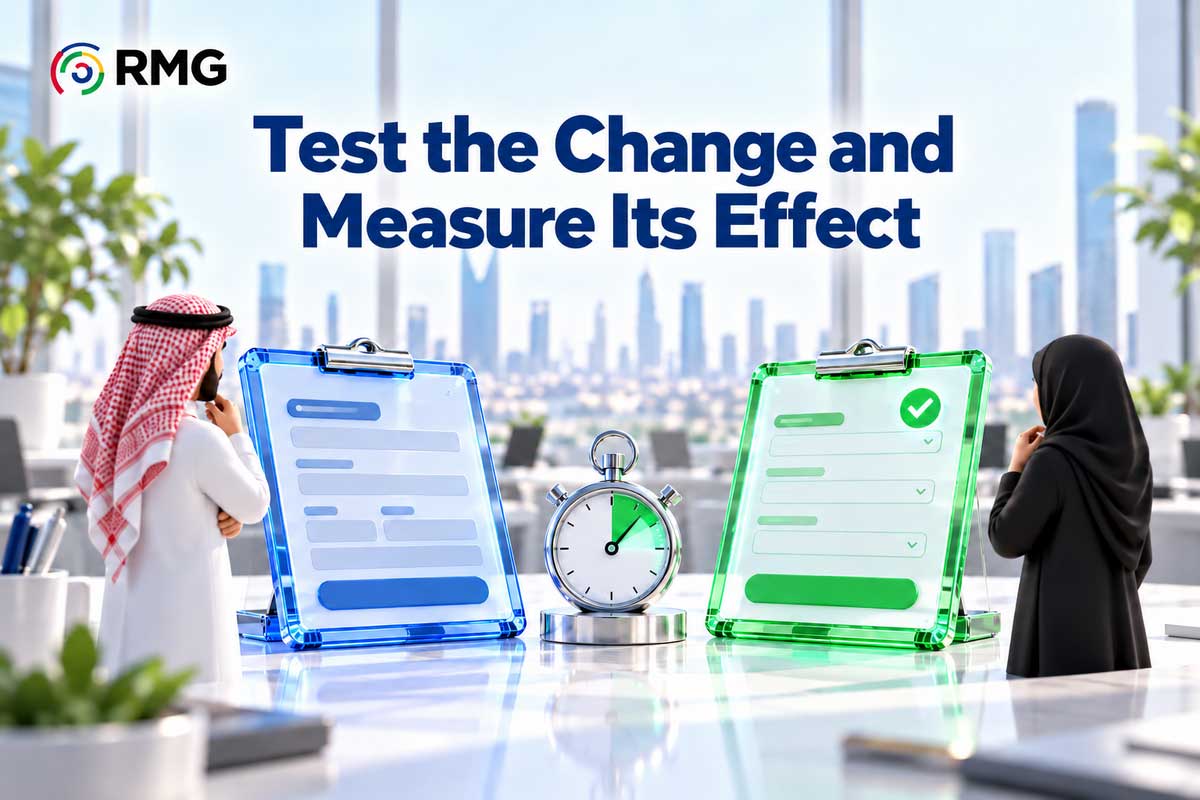
Conceptual illustration of a bounded change and measurement of its effect on task completion.
Make the next decision explicit
At the end of the cycle, assemble a one-page account of the original problem, the change, the outcome, remaining uncertainty and effects across groups or channels. Decide whether to continue on a limited basis, revise the hypothesis, stop or expand in line with evidence and operational capacity. Refresh the journey ranking as knowledge improves.
RMG’s Digital Journey Design and Orchestration service describes current-journey analysis, touchpoint design, coordination across channels and performance monitoring [1]. A useful discussion begins with a precise question: which journey do we have a clear reason to improve now, and what evidence will show that beneficiaries can achieve their goal more effectively?