

Blog Body
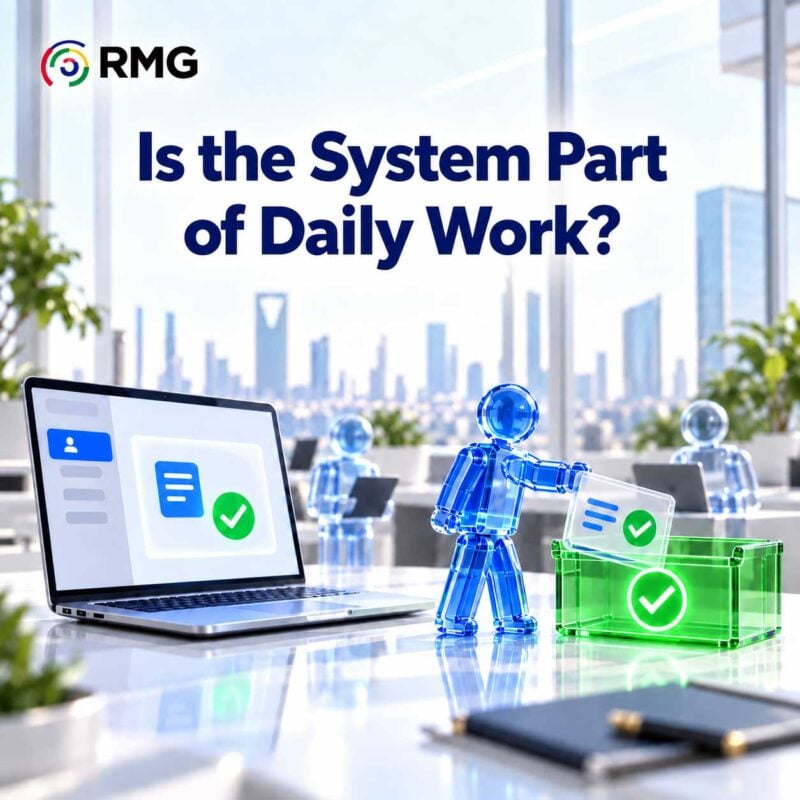
Numbers after a system launch can look reassuring: training is complete, accounts are enabled and logins are rising. Yet an employee may sign in every morning and still do the real work in a separate spreadsheet. Another may complete tasks only with a colleague guiding every step. The useful question is whether the system has become a dependable part of how work gets done.
Measuring employee digital adoption starts with a meaningful task, then connects behaviour with barriers, support and operational results. The dashboard proposed here is a practical starting point. It is neither a mandatory standard nor an official assessment model, and it does not treat one indicator as proof of project success.
Separate training, access and useful behaviour
Training attendance shows that an enablement activity reached someone. It does not establish that the person learned the skill or applied it. A login demonstrates access, but says little about completed work. Useful behaviour needs a business definition: submitting a complete request, processing a case through the agreed workflow, or updating a record used in a subsequent decision.
Even “active user” has different meanings across products. Microsoft 365 documentation defines activity through actions that vary by service, including file interactions and participation in conversations. Read the metric’s definition before presenting it to leadership as evidence of adoption.
A useful monitoring structure separates readiness, access, meaningful behaviour and operational outcomes. These layers are connected, but cannot substitute for one another. More activity accompanied by more rework should prompt a quality investigation.
Define the behaviour before selecting the metric
Start with one valuable scenario, such as submitting a complete purchase request. Specify who performs it, when they need it, where it begins and ends, and where assistance is acceptable. Agree with the process owner what successful completion means.
The entire workforce is rarely the right denominator for every rate. For a task triggered by a particular event, employees who actually needed to perform it during the period provide a more useful population. Someone who received no case is not necessarily reluctant to use the system. Document exclusions so that removing difficult cases cannot quietly improve the reported rate.
For each metric, record the event definition, unit, period, source, denominator, exceptions and owner. Keep people and transactions separate: one employee may complete ten transactions. Comparing those counts without explaining the distinction confuses the discussion.
Build a dashboard that leads to action
The dashboard’s value comes from the decisions it supports. Adapt the following components to the process:
| Dimension | Question and suggested measure | Decision supported |
| Behaviour | Who completed the defined task, and repeated it when next needed? | Identify groups needing follow-up |
| Barriers | Where does work stop, require correction or return to another channel? | Fix a specific obstacle |
| Support | What assistance was needed, and could the employee proceed afterwards? | Match support to the cause |
| Outcome | Was the task completed correctly, with acceptable time and rework? | Check whether usage is useful |
Microsoft’s Power Platform value guidance recommends combining interviews, surveys, performance indicators and usage analytics. In practice, system records show what happened, while observation and questions help explain why.

Conceptual illustration distinguishing access from actual task completion.
Choose a measurement window that reflects task frequency. Daily activity is a poor standalone test for a monthly process. Likewise, a quiet week and a financial closing week may not be comparable. Show workload and procedural changes alongside trends.
An illustrative example: different numbers, different decisions
Consider a fictional organisation launching a purchasing system with 120 licensed employees. Training reached 108 employees. During a two-week period, 90 employees needed to submit requests; 84 logged in and 54 completed a valid request without direct assistance.
These are hypothetical figures, not RMG or customer results. Training attendance is 90% of licensed employees. Independent task completion is 60% of those who needed the task: 54 out of 90. The difference warrants investigation, but does not by itself prove ineffective training; the populations and measurement purposes differ.
A separate transaction record for the same period shows 100 requests started and 80 completed, including 72 requiring no correction. Completion is therefore 80% of starts, while first-time quality is 90% of completions. Neither number means that 80 employees adopted the system: one employee can submit several requests.
This completion measure follows the distinction in the GOV.UK Service Manual between transactions started and transactions reaching a defined endpoint. It is used here as measurement guidance, without transferring UK government service obligations to Saudi organisations. [3]
If observation reveals that approved suppliers are missing from a selection list, another training session will not fix the issue. If users struggle with the same step despite having the data and permissions, clearer instructions or a redesigned screen may be necessary.
Match each barrier to appropriate support
Classify feedback into actionable causes. A knowledge gap may need brief task guidance or practical training. An access problem belongs with the technical owner. An unclear procedure needs a process decision. A usability issue requires observing and improving the interaction, rather than labelling the employee resistant to change.
Look for conflicting expectations. Does a manager require both a system update and the old spreadsheet? Is support available when the task is performed? Do devices and connectivity work in every location? Returning to an old method may be a response to an obstacle the project team has not seen.
Rising support tickets do not automatically indicate deterioration; they may reflect greater use or easier access to help. Classify issues, relate volumes to transactions, and track recurrence after resolution. Falling tickets also need interpretation: users may be succeeding, or may have stopped trying.

Conceptual illustration of matching support to the cause of friction.
Make measurement a managed improvement cycle
In a brief weekly review, the process owner, change team and support team should ask: what behaviour changed, where is friction concentrated, what intervention comes next, and when will its effect be reviewed? Give each action an owner, a date and a verification measure. Test changes at an appropriate scale before expanding them.
Retain a baseline, compare similar periods and record changes in workload, policy or team composition. Improvement after an intervention does not alone establish causation. GOV.UK’s service measurement guidance also recommends combining performance data with user research instead of relying solely on digital analytics.
Use the dashboard to improve work, presenting aggregated data where practical and defining who needs detailed information and why. Explain the purpose of monitoring and the available feedback channels. Separate service improvement needs from any individual performance assessment, following the organisation’s approved policies.
Protect employee data when measuring adoption
SDAIA’s guide explains that identifiable employee data falls within the Personal Data Protection Law and that the guide does not replace the law or regulations [6]. Review the dashboard’s purpose and access rights with the responsible specialist. Removing names does not prevent identification if records can be linked to other sources.
Separate an aggregated management view from case details needed by support teams. Avoid small groups that reveal an individual, and define retention according to purpose and applicable requirements. The practical aim is to fix barriers and improve support, with an explicit explanation for any other use of the data.
Make the new way of working dependable
Adoption becomes more convincing when employees can complete the right task when needed, recurring obstacles diminish and support addresses their causes. A complex dashboard is not a prerequisite. A clear scenario, reliable evidence and an accountable owner can provide a useful starting point.
RMG’s Digital Adoption and Change Management service covers readiness assessment, adoption and communication planning, enablement, indicator monitoring and improvement. A discussion can start with one work behaviour the organisation wants to establish, and the barriers preventing employees from performing it confidently. The linked service description is in Arabic.