


Blog Body
Every weekly task can be completed while the strategic target remains distant. A page is updated, a meeting held and a report delivered; a growing collection of green status marks creates an impression of progress. Performance leaders need a deeper answer: what outcome were these activities meant to change, and what evidence shows that the change occurred?
Good alignment helps employees understand why they are doing a task and helps leaders identify where effort stops translating into results. This article proposes a model connecting a goal, initiative, project, task and measure. It supports understanding and testing contribution; it does not make the percentage of closed tasks equivalent to strategic target attainment.
Define the outcome before assigning the work
Describe the change wanted for users or the organization, then specify a target stating its extent and timing. “Improve the service” is broad; reducing applications returned for missing requirements is an outcome that can be examined. Record the service scope, relevant population, baseline and outcome owner, including whether improvement means a higher or lower indicator value.
GOV.UK’s service-benefits guidance connects project outputs and enabling changes with benefits and wider strategic objectives. [1] In the proposed model here, write a brief rationale for each link: this change should support the outcome because it reduces a particular obstacle. If the team cannot explain the relationship, it may need more evidence or a different intervention.
Avoid choosing an indicator simply because it is easy to collect. Updated-page counts describe delivery volume, but do not establish whether users can submit complete applications. Several initiatives may contribute to one goal. Explain their respective contributions and shared assumptions, without crediting every project with the entire outcome.
Build a relationship the team can trace
In this model, an initiative coordinates work toward an intended change, a project defines a bounded deliverable, and a task produces an acceptable part of that deliverable. Measurement tests delivery and outcomes. Organizations may use different terminology; agree consistent definitions and understandable relationships without adding management layers that the work does not need.
Consider a wholly hypothetical organization seeking fewer applications returned for missing requirements. It chooses an initiative to improve the application experience and a project to update the requirements page. One task is to clarify accepted attachment formats. This is not a client example or a reported result, and it does not assume that content is the only cause of returns.
| Level | Hypothetical example and evidence |
| Goal and target | Reduce returns for missing requirements from a hypothetical 20% baseline to 12% or less by the end of the next quarter. |
| Initiative | Improve the application experience, informed by analysis of missing requirements. |
| Project | Update the requirements page with an agreed scope, deliverable and owner. |
| Task | Clarify accepted attachment formats; completion evidence is the published version reviewed by the service owner. |
| Measure | Track the return rate for missing requirements, with consistent scope, denominator and data source. |
The task needs an owner, deadline and acceptance criterion: for example, published formats match service rules and guidance appears in the correct place. Checking whether users understand the guidance requires an appropriate user evaluation. Publishing the page does not close outcome monitoring. Agree beforehand when sufficient data will be available for review and who will supply it.
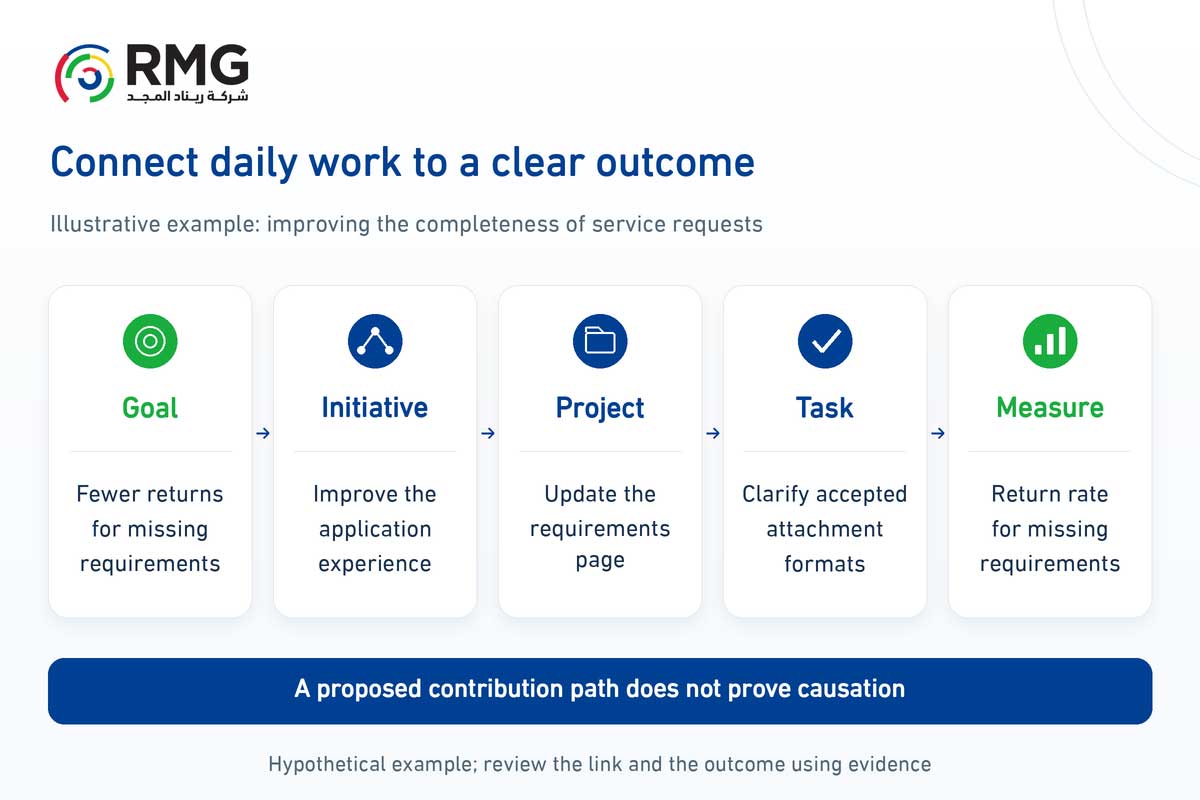
The relationship explains why the task is needed; measurement then tests its expected contribution to the goal.
Define the indicator before comparing percentages
Give each indicator a short specification: definition, numerator and denominator where relevant, data source and owner, update frequency, baseline, target and measurement date. GOV.UK’s performance guidance emphasizes meaningful measures, data sources, comparison context and baselines. [2] The following details are a proposed application to this example, not benchmark values or requirements of a particular product.
First define the cohort of unique applications whose initial screening was completed during the period, within the agreed service and scope. Calculate the return rate by dividing applications in this cohort returned for missing requirements as a result of their initial screening by all applications in the cohort, then multiplying by 100. Track subsequent returns separately. Exclude applications awaiting completed initial screening from the denominator, but show their volume and age separately so the indicator does not conceal an unresolved backlog.
In the hypothetical baseline, 40 of 200 applications with completed initial screening were returned, giving 20%. The proposed target is 12% or less by the end of the next quarter, not an achieved result or a promise. Keep reason definitions, submission channels and selection rules consistent in later comparisons, and examine changes in application mix and volume. Explain definition changes instead of silently joining incomparable series.
The data owner approves extraction, deduplication and missing-data rules. The service owner reviews how return reasons are interpreted, while the goal owner follows the outcome and required decision. Roles may overlap according to organizational size, provided accountability remains clear. A complete task register cannot turn incomplete data into a reliable measure, and a missing value is not zero.
Keep task completion separate from target attainment
Present two questions together: was the work delivered to its acceptance criterion, and did the indicator move toward the target after an appropriate interval? If the page is published but the rate remains high, examine whether people find and understand the guidance, alongside other causes such as differing screening rules or complex required documents. Adding superficial tasks to improve completion statistics does not resolve that gap.
The indicator might also fall for other reasons, including a different application mix or a simultaneous communications campaign. QPIE guidance distinguishes observing an outcome change from establishing that an intervention caused it. [3] Report improvement as an observed result with clear interpretive limits, and use deeper evaluation where the decision requires evidence of impact. A planning link represents expected contribution, not proven causation.
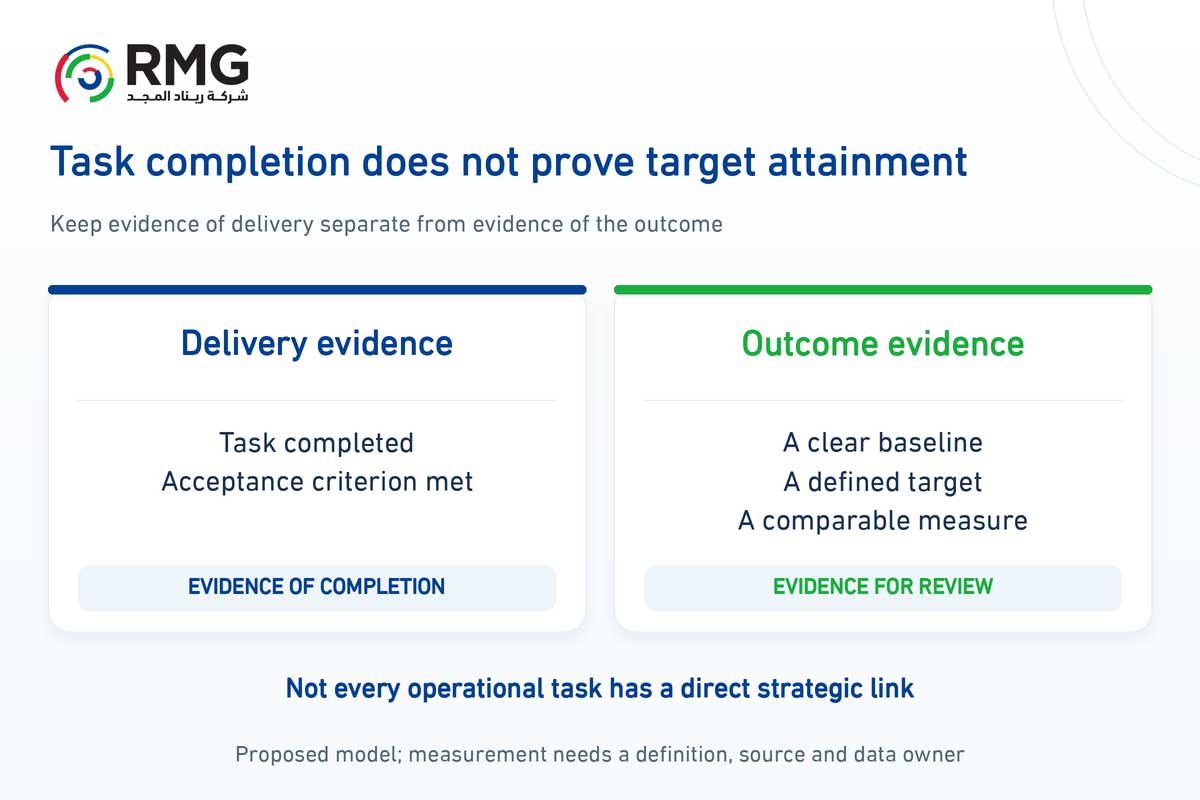
Delivery requires acceptance evidence; outcomes require comparable measurement and a responsible interpretation.
Keep operational work visible and review the relationship
Not every task needs a direct strategic-target link. Maintaining work access, resolving a routine fault or completing an administrative process may sustain operations or enable several projects. Classify this work clearly and identify its service or obligation, owner and standard. An artificial strategic link hides capacity consumption and weakens the meaning of priorities.
At periodic reviews, discuss late work, outcomes that have not moved despite completed delivery, and assumptions that have changed. Decide whether to continue, modify or stop work within the relevant authority, documenting scope or target changes. If project progress uses weights, agree them beforehand. Averaging task completion percentages does not automatically measure strategic impact.
RMG’s Strategy, Projects and Tasks Management System page describes linking plans to goals, initiatives, projects and tasks, alongside customizable performance indicators. [4] The quality of these relationships, measurement definitions and interpretation remain organizational responsibilities. Request a demonstration from RMG to discuss applying the approach to your goals and operations, so teams can see both what they delivered and which effects still need verification.