
Blog Body
Ask what will change after the dashboard is read
A dashboard can contain dozens of visuals and still end a meeting with a request for another report because the decision is unclear. Start with the user, the decision they can make and when they need it. Do not remove a metric solely because it triggers no immediate action: it may support accountability, obligations or understanding a trend. Every element should nevertheless have a defined purpose and location. Supporting detail can sit in a separate report rather than compete with essential information.
Define the business question before the visual
Frame a question the owner can act on, such as where requests are accumulating and may need reassignment. Specify the service, period and relevant group rather than using a broad heading such as operational performance. Microsoft’s design guidance asks about the audience and decision-relevant metrics and recommends highlighting essential information and reducing clutter [2]. This is design guidance, not an official fixed metric count or a requirement to use a particular product.
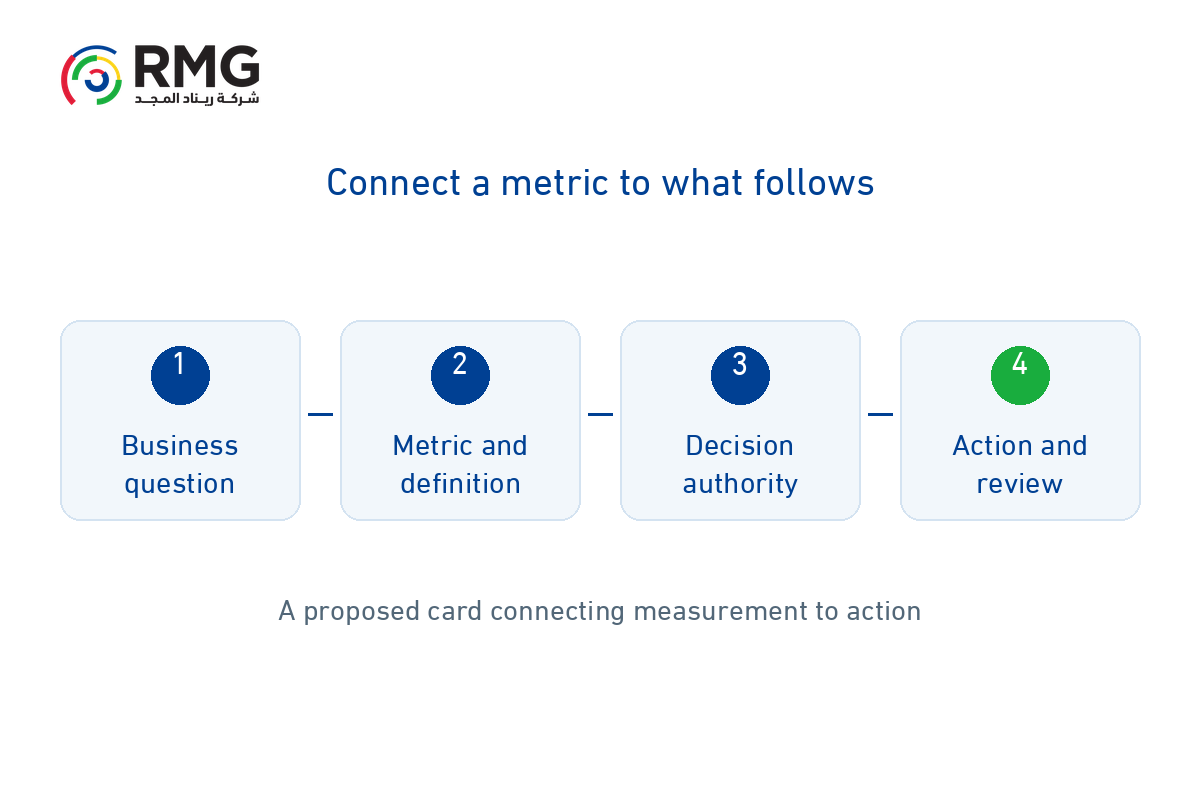
Complete a metric and decision card
Record the question, definition, source, reporting period, last refresh, definition owner, decision owner, available action and review timing. The person responsible for data quality may differ from the person authorized to reassign resources; document both. Include interpretation conditions and limitations such as missing records or coverage differences. If the decision owner or response cannot be identified, reconsider placing the metric on the leadership page before creating another visual.
| Card element | Verification question |
| Question and definition | Which decision, calculation, scope and period? |
| Source and confidence | Who owns the data, when was it refreshed and what are its limits? |
| Owner and action | Who can act and what response is available? |
| Follow-up | When is it reviewed and how are decision and outcome recorded? |
Align definitions and context before comparison
Check numerator, denominator, exclusions, unit and reporting period before comparing departments. An attractive color does not resolve inconsistent definitions. Show refresh timing and incomplete-data notices, with a route to authorized detail. When a definition changes, record its edition, effective date and effect on historical comparisons. A delayed metric may describe a condition that has already changed, so do not present it as a live operational view.
Choose what belongs on the main page
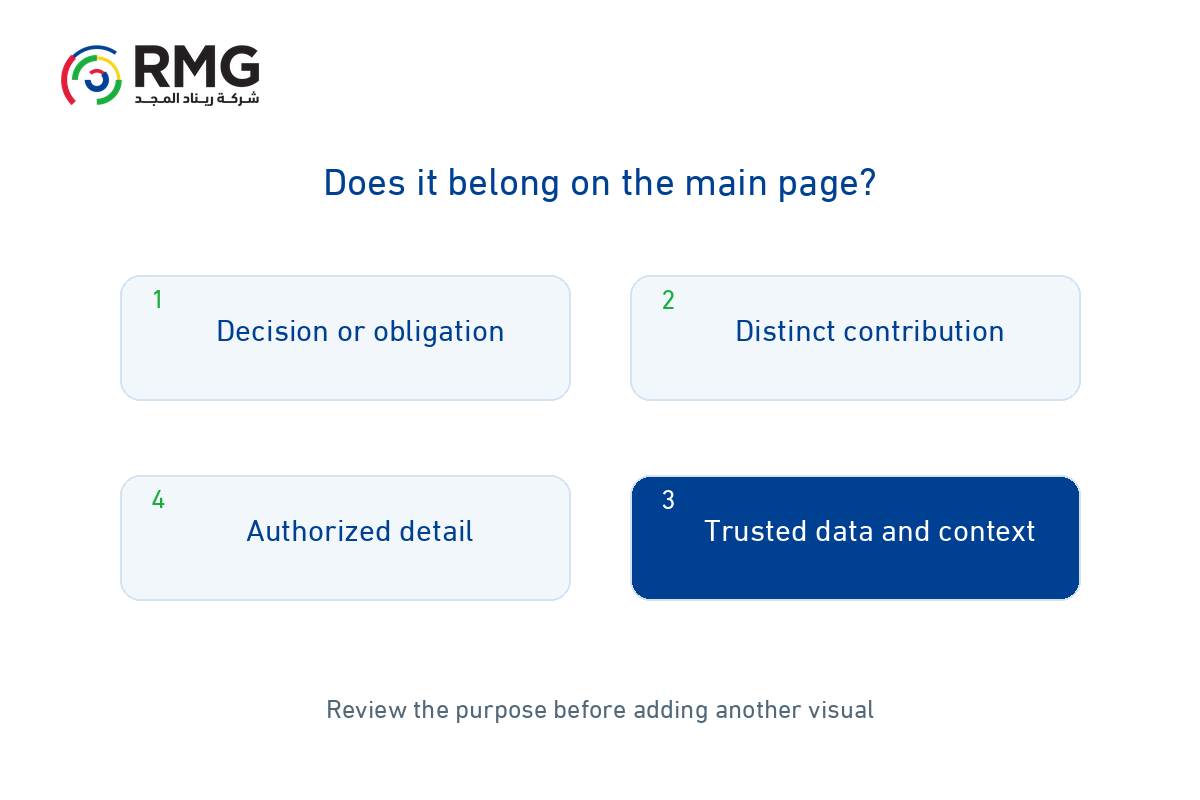
Review each element with the business owner: does it support a recurring decision, important obligation or warning that needs follow-up? What does it add beyond other elements? Place the summary on the main page and explanation and detail at later levels. Distinguish performance from data quality visually; incomplete records may require source correction before performance interpretation. Test the layout on a phone and avoid using color as the only way to communicate status.
Illustrative example: from request backlog to action
For a fictional service, ask where request waiting is increasing. The metric is the age distribution of open requests by stage, using a common definition that excludes closed cases. The service manager owns the decision; a possible response is to investigate the blockage and reassign work within delegated authority. The team agrees review timing suited to the service cycle and first checks source quality. Backlog alone does not prove understaffing: it may reflect a failed integration or pending approval. This example uses no client data or standard thresholds.
Protect data when providing detail
If the dashboard or drill-through contains personal data, review purpose, access, minimum necessary information and retention with the responsible specialist. Check applicable Saudi requirements; removing names alone does not establish anonymization. SDAIA guidance connects collection to need and purpose [3]. Leaders may need an aggregated view while an authorized analyst needs restricted detail. The proposed decision card is an operating practice, not compliance certification or justification for unrestricted access.
Test the dashboard with a real decision scenario
Ask a user to explain the signal, its possible cause and the action they would take, then record confusion and missing context. After use, review documented decisions and completed actions rather than relying only on page views. RMG describes business intelligence services covering objectives, indicators, data collection and cleansing, analysis and presentation [1]. Start with RMG by reviewing questions, metric cards and sources, then design a dashboard whose use and effects can be assessed.